Getting Started with GoCD on Kubernetes
Explanation of the sample pipelines
In this section, we’ll explain the details of each of the pipelines imported in the previous section.
1. Build and publish image
This pipeline builds an application artifact and publishes it to an artifact store.
The material
A GoCD pipeline’s material is the trigger for a pipeline. Often it is a source code repository. It could also be another GoCD repository. A change in a material causes a pipeline to run.
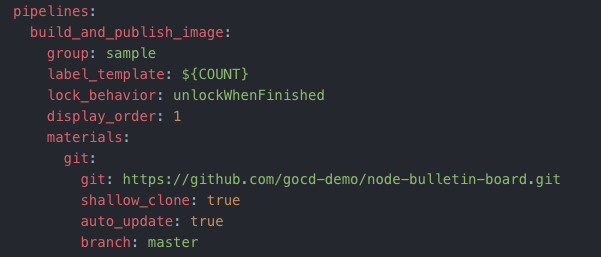
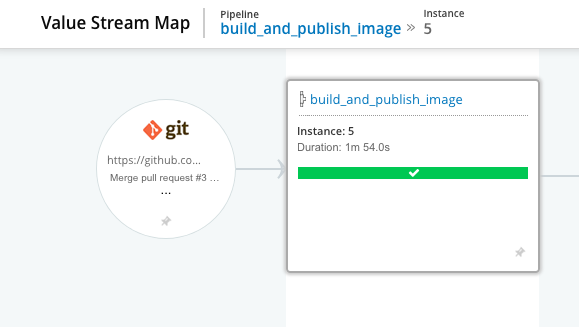
The material for the build_and_publish_image pipeline is a Git repository.
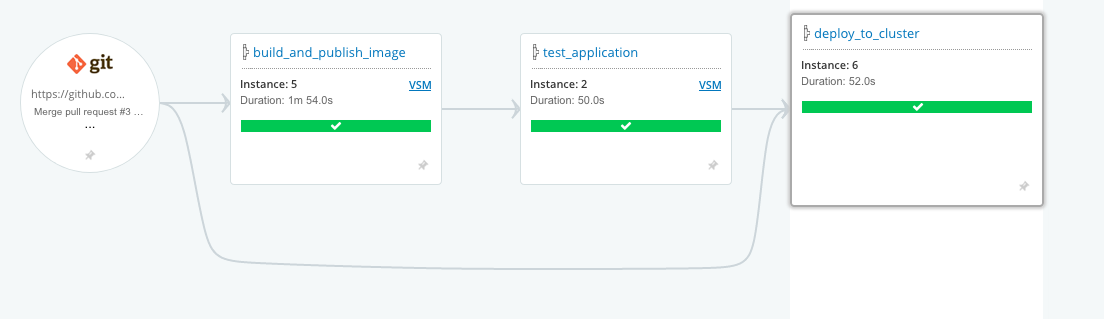
When the pipeline is imported, the material is rendered on the Value Stream Map page as the trigger for the build_and_publish_image pipeline.
Stages and jobs
In GoCD, stages and jobs are workflow constructs that allow for sequential or parallel execution of build tasks.
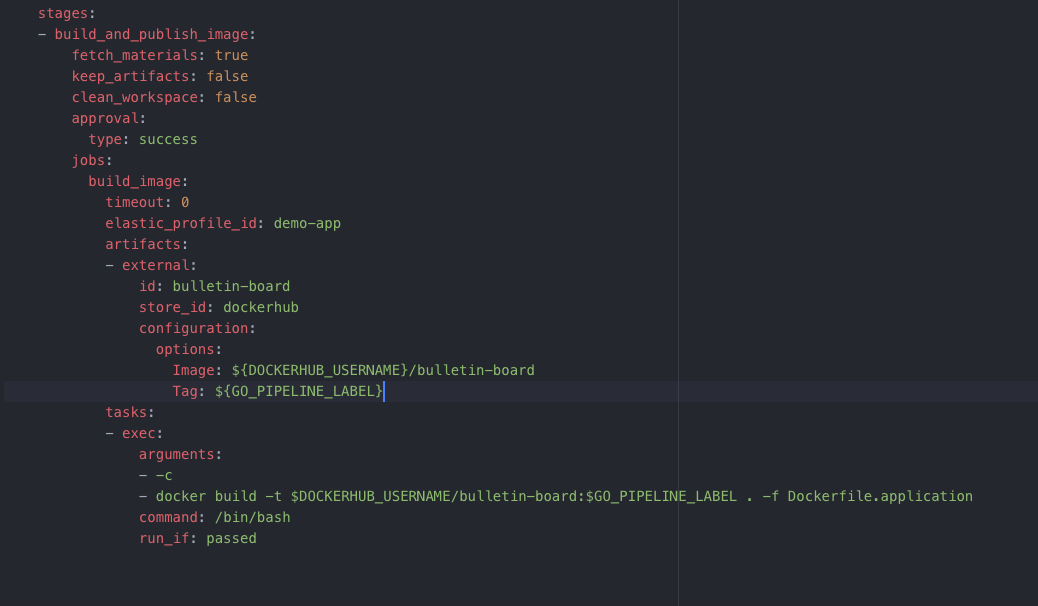
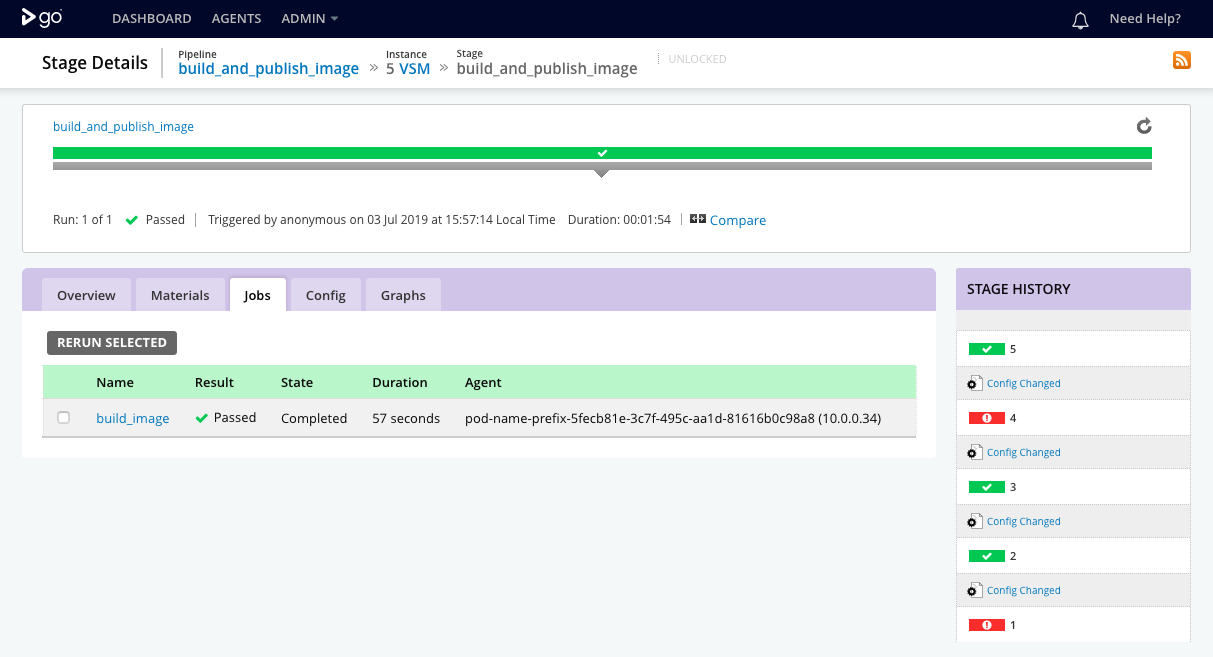
The build_and_publish_image pipeline has one stage called build_and_publish_image with one job called build_image.
Clicking on a stage or a job on the GoCD user interface shows you the results of execution of the stage and its constituent jobs.
Job details
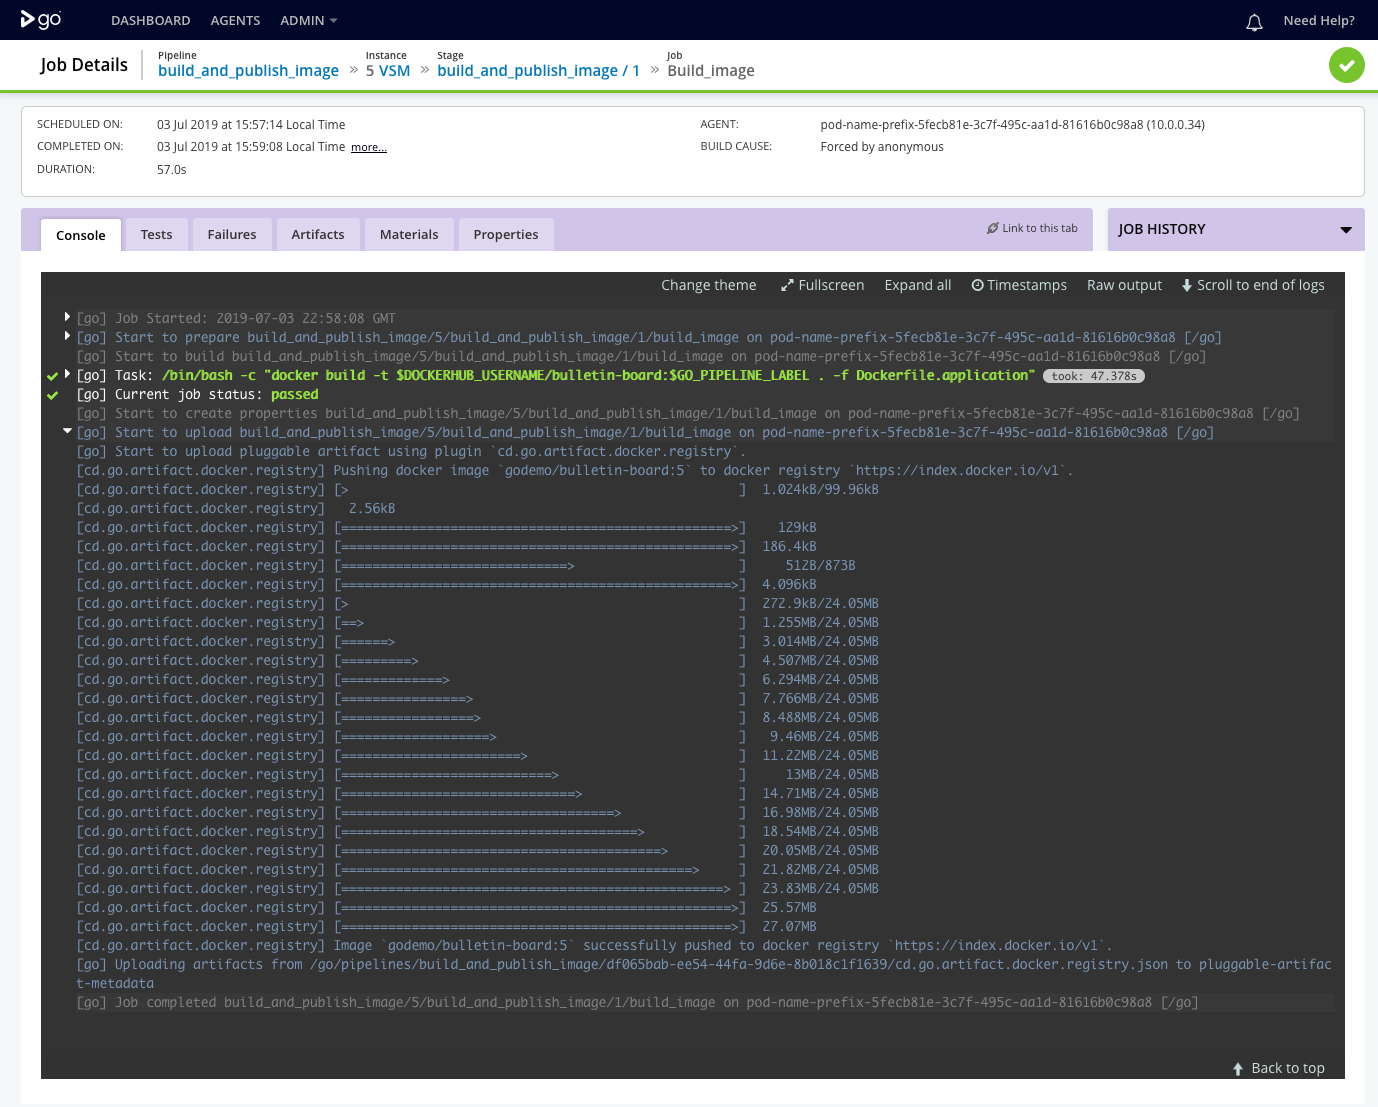
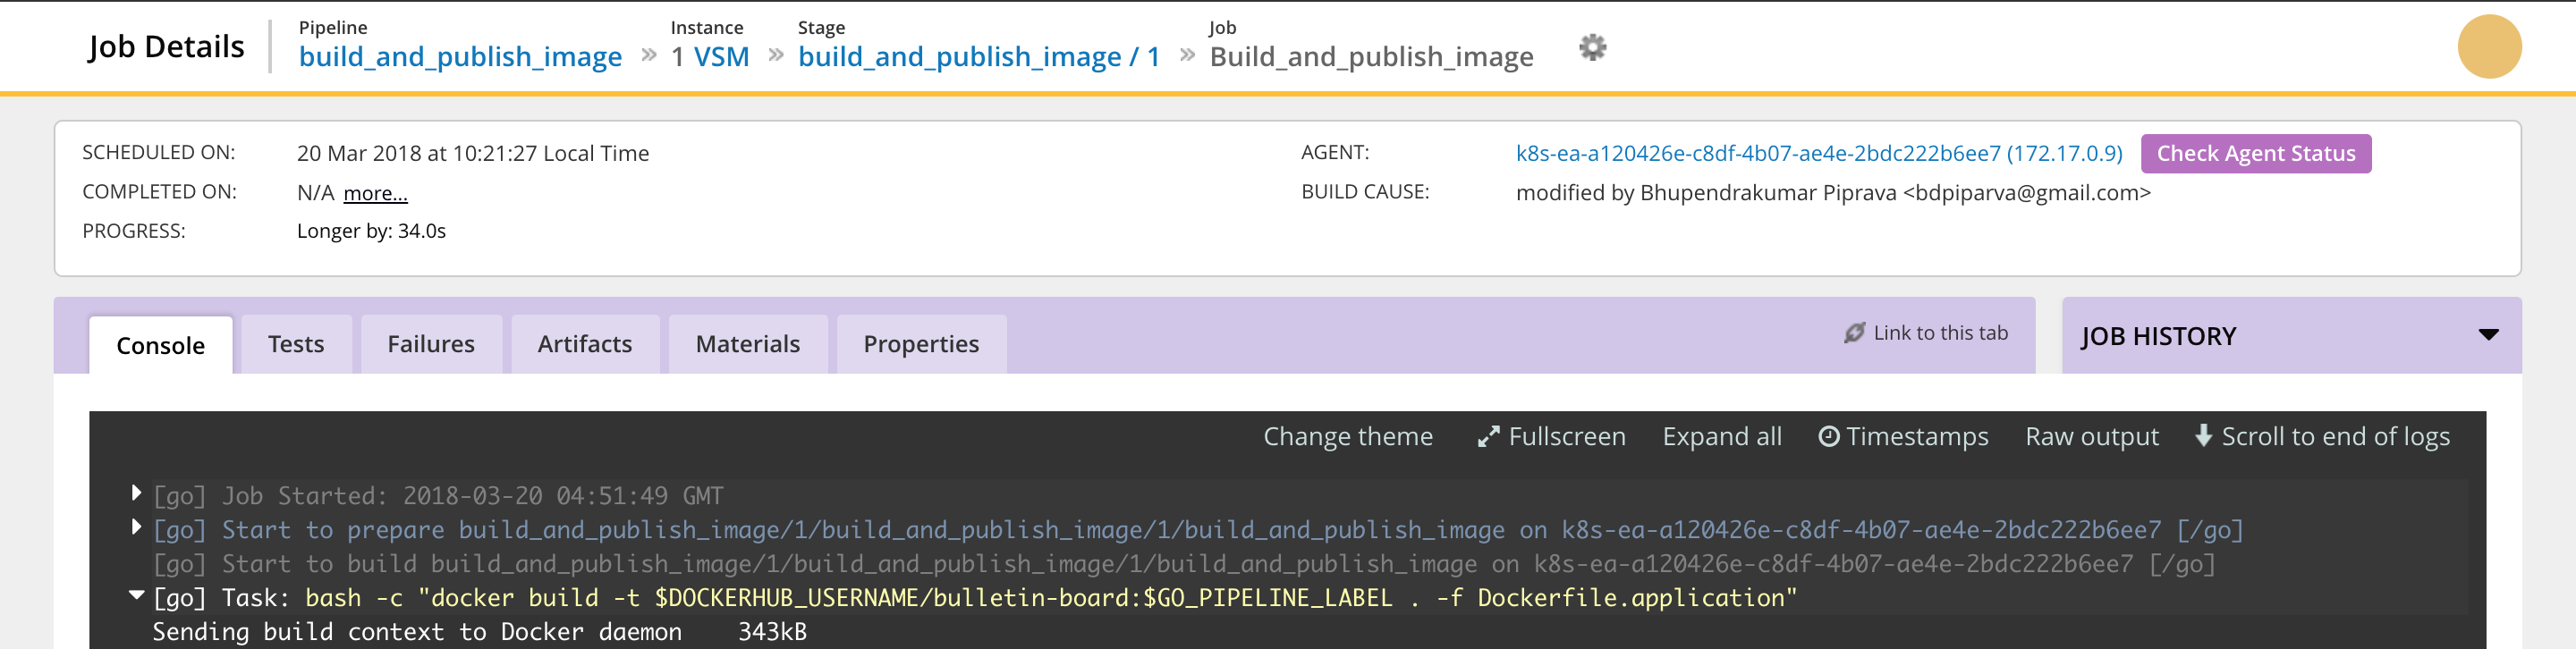
The build_image job builds a Docker image artifact for the sample application. It then publishes the Docker image to a Docker registry configured under Admin -> Artifact Stores.
Elastic profile
The elastic_profile_id assigns this job to an elastic profile. When this job is triggered, an elastic agent is provisioned based on the elastic profile and is assigned to this job.
External artifacts
The external artifact configuration in the job definition uses the Docker registry artifact plugin to push the docker image to the Docker registry once it is built.
The console tab for the build_image job shows this interaction.
2. Test application
This pipeline fetches the Docker image built in the previous build_and_publish_image pipeline and runs tests against it.
The material
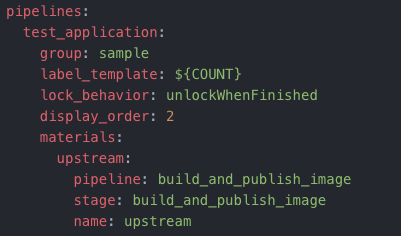
The material for the test_application pipeline is the previous build_and_publish_image pipeline. By specifying a pipeline material, test_pipeline will be triggered whenever the previous build_and_publish_image pipeline completes successfully.
The test_application pipeline can also reach out and fetch any artifacts that the build_and_publish_image pipeline generates and stores on the GoCD server.
Note: Build artifacts could either be stored on the GoCD server or an external artifact store like a Docker registry.
Stages and jobs
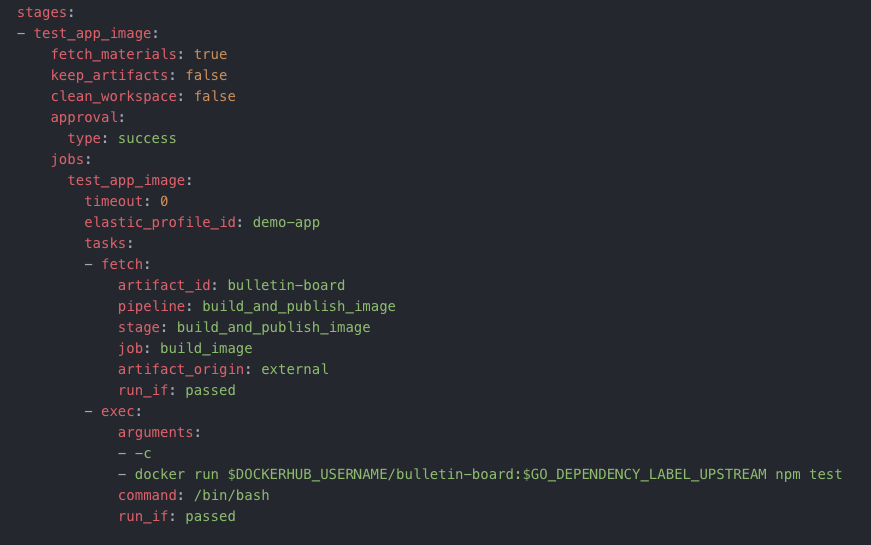
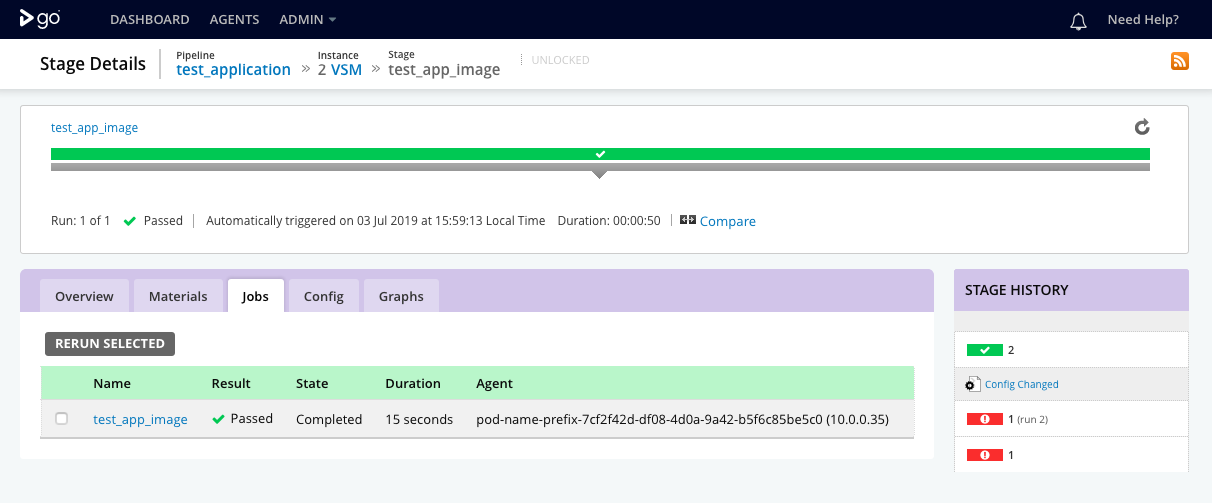
The test_application pipeline has one stage called test_app_image with one job called test_app_image.
The stage details page shows the result of exection of the stage and its constituent jobs.
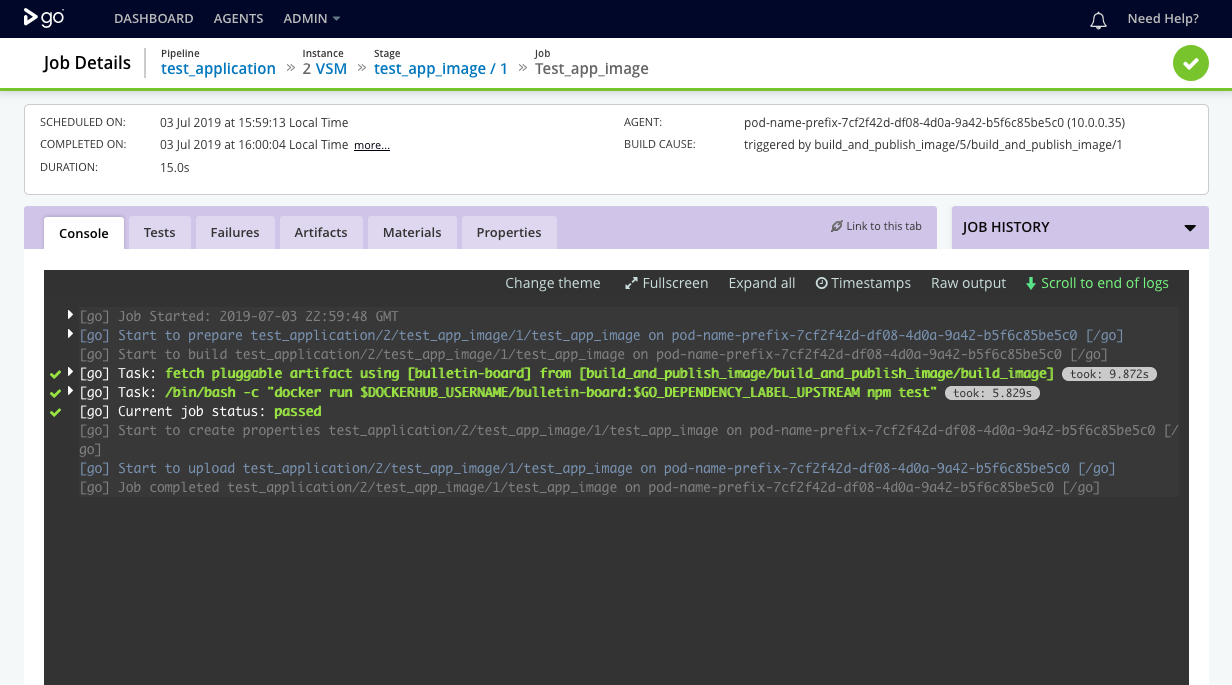
Job details
GoCD build agents run as Docker In Docker containers. The test_app_image job fetches the application’s Docker image and runs the application’s test command on an application container. It does so by executing the docker run command.
Elastic profile
The elastic_profile_id assigns this job to an elastic profile. When this job is triggered, an elastic agent is provisioned based on the elastic profile and is assigned to this job.
Fetching artifacts
The fetch task is configured with the application image to be pulled from the Docker registry configured under Admin -> Artifact Stores.
This interaction is shown in the console tab of the test_app_image job.
3. Deploy to cluster
This pipeline deploys an application artifact to a Kubernetes cluster.
The material
The deploy_to_cluster pipeline has two materials.
The first material is the previous test_application pipeline. The second material is a Git respository where the deployment scripts are stored.
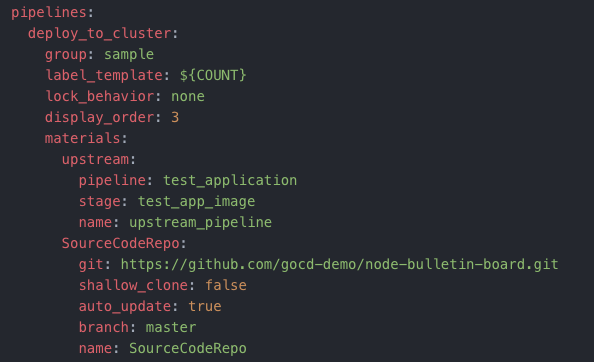
The deploy_to_cluster pipeline will be triggered either on successful completion of the upstream test_application pipeline, or on a commit to the Git repository material.
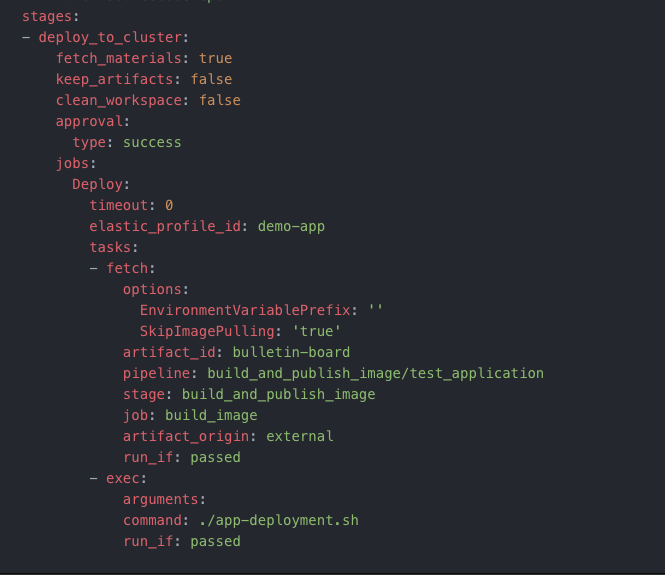
Stages and jobs
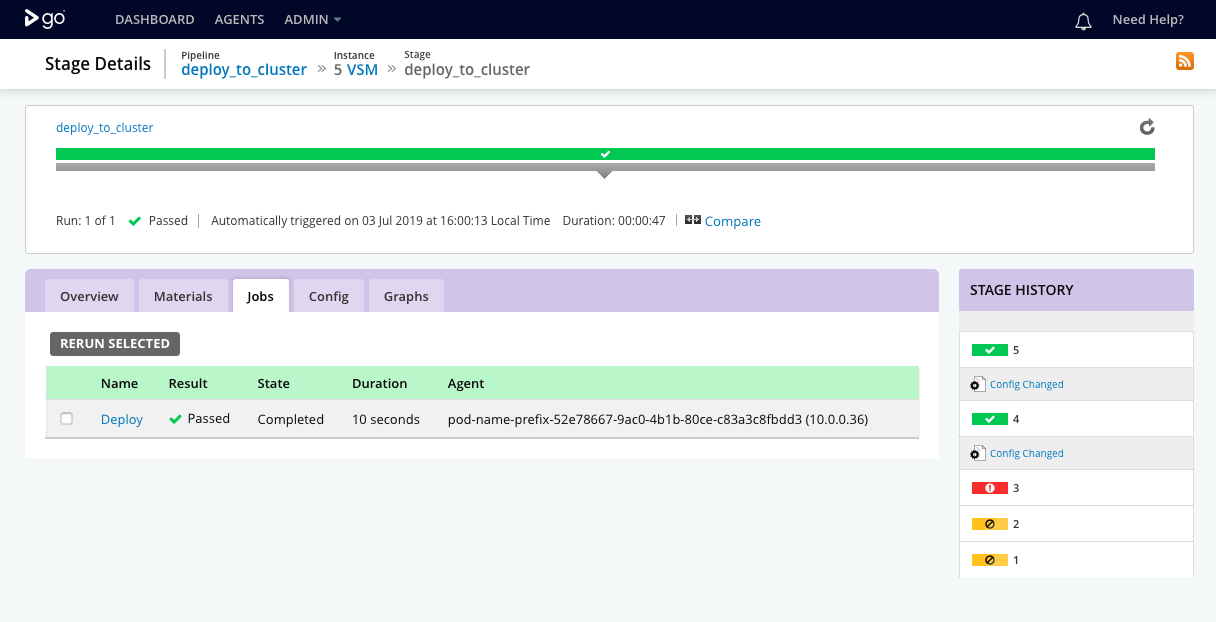
The deploy_to_cluster pipeline has one stage called deploy_to_cluster with one job called Deploy.
The stage details page shows the result of exection of the stage and its constituent jobs.
Job details
The Deploy job fetches the application’s Docker image metadata and makes it available for use in the environment. It then calls a deployment script to deploy the application to Kubernetes.
Elastic profile
The elastic_profile_id assigns this job to an elastic profile. When this job is triggered, an elastic agent is provisioned based on the elastic profile and is assigned to this job.
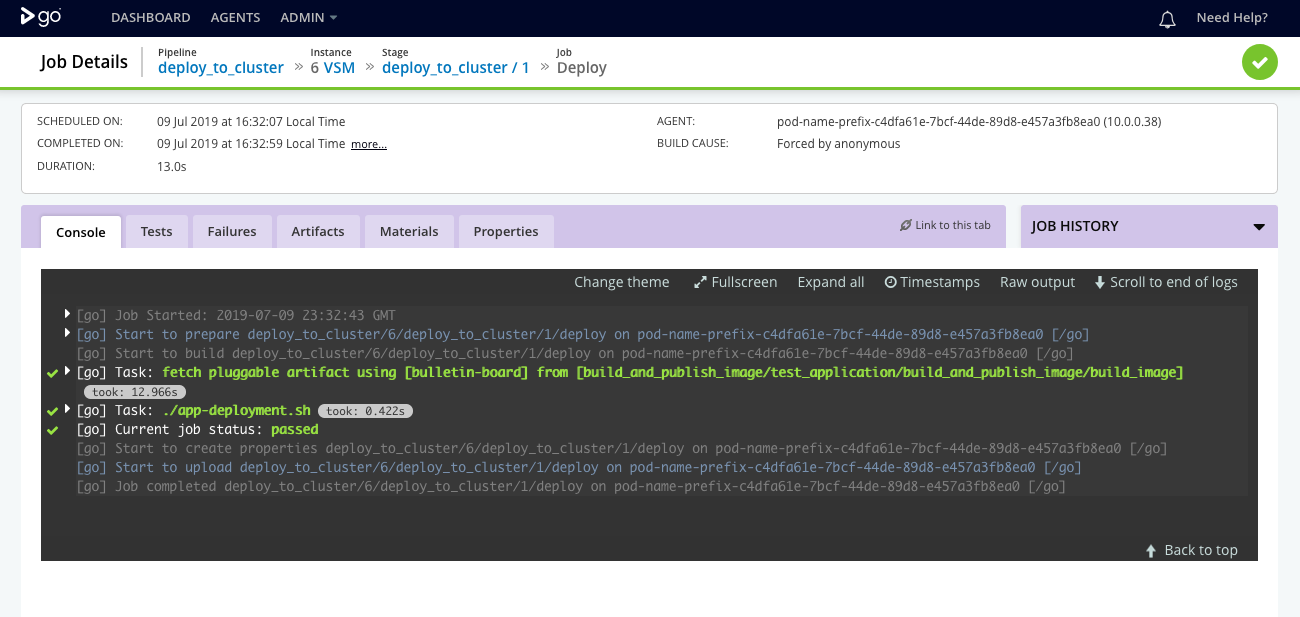
Fetching image metadata
Since deploying to Kubernetes doesn’t require the application image to be pulled down to the build agent, the fetch task is configured to fetch the application image metadata. The metadata is then made available for further tasks in the job.
This interaction is shown in the console tab of the deploy job.
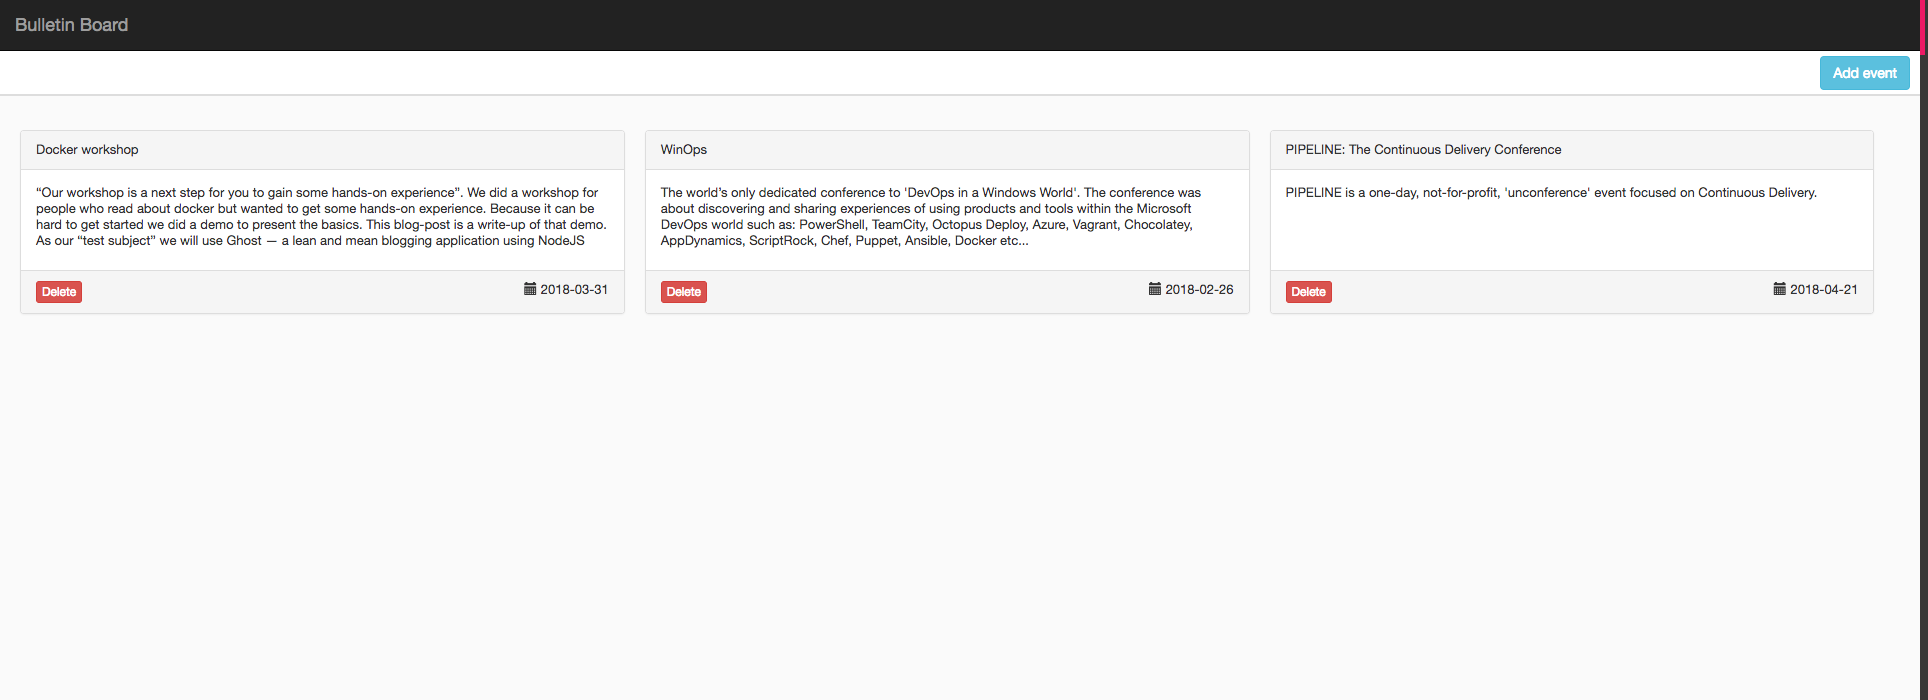
Access your application
Once the pipeline has run successfully, go to http://<ingress-ip>/bulletin-board to see your deployed sample application.
Getting the new ingress IP address for the deployed application:
-
For Minikube:
minikube ip -
For other Kubernetes implementations:
echo "http://$(kubectl get ingress bulletin-board-ingress --namespace $NAMESPACE -o jsonpath="{.status.loadBalancer.ingress[0]['ip']}")"
Check the status of agents with Agent Status Report
When the pipeline is running (signified by a yellow bar), you can take a look at the status of the agents that are assigned to run the jobs in the pipeline. You can find the following information here:
-
Pod details & configuration
-
Pod events
-
Logs for the agents
This can be useful to troubleshoot when an agent is not picking up the job.
To access the agent status report:
-
Click on a stage of your choice when the pipeline is being built.
-
You’ll see the stage detail page with a list of jobs. Click on the job that you wish to see the agents of.
-
This is the job detail page which has a console log. Click on the button titled ‘Check Agent Status’.
-
Clicking on this will take you to the Agent Status Report. The
EventsandLogstabs display the GoCD elastic agent pod events and logs.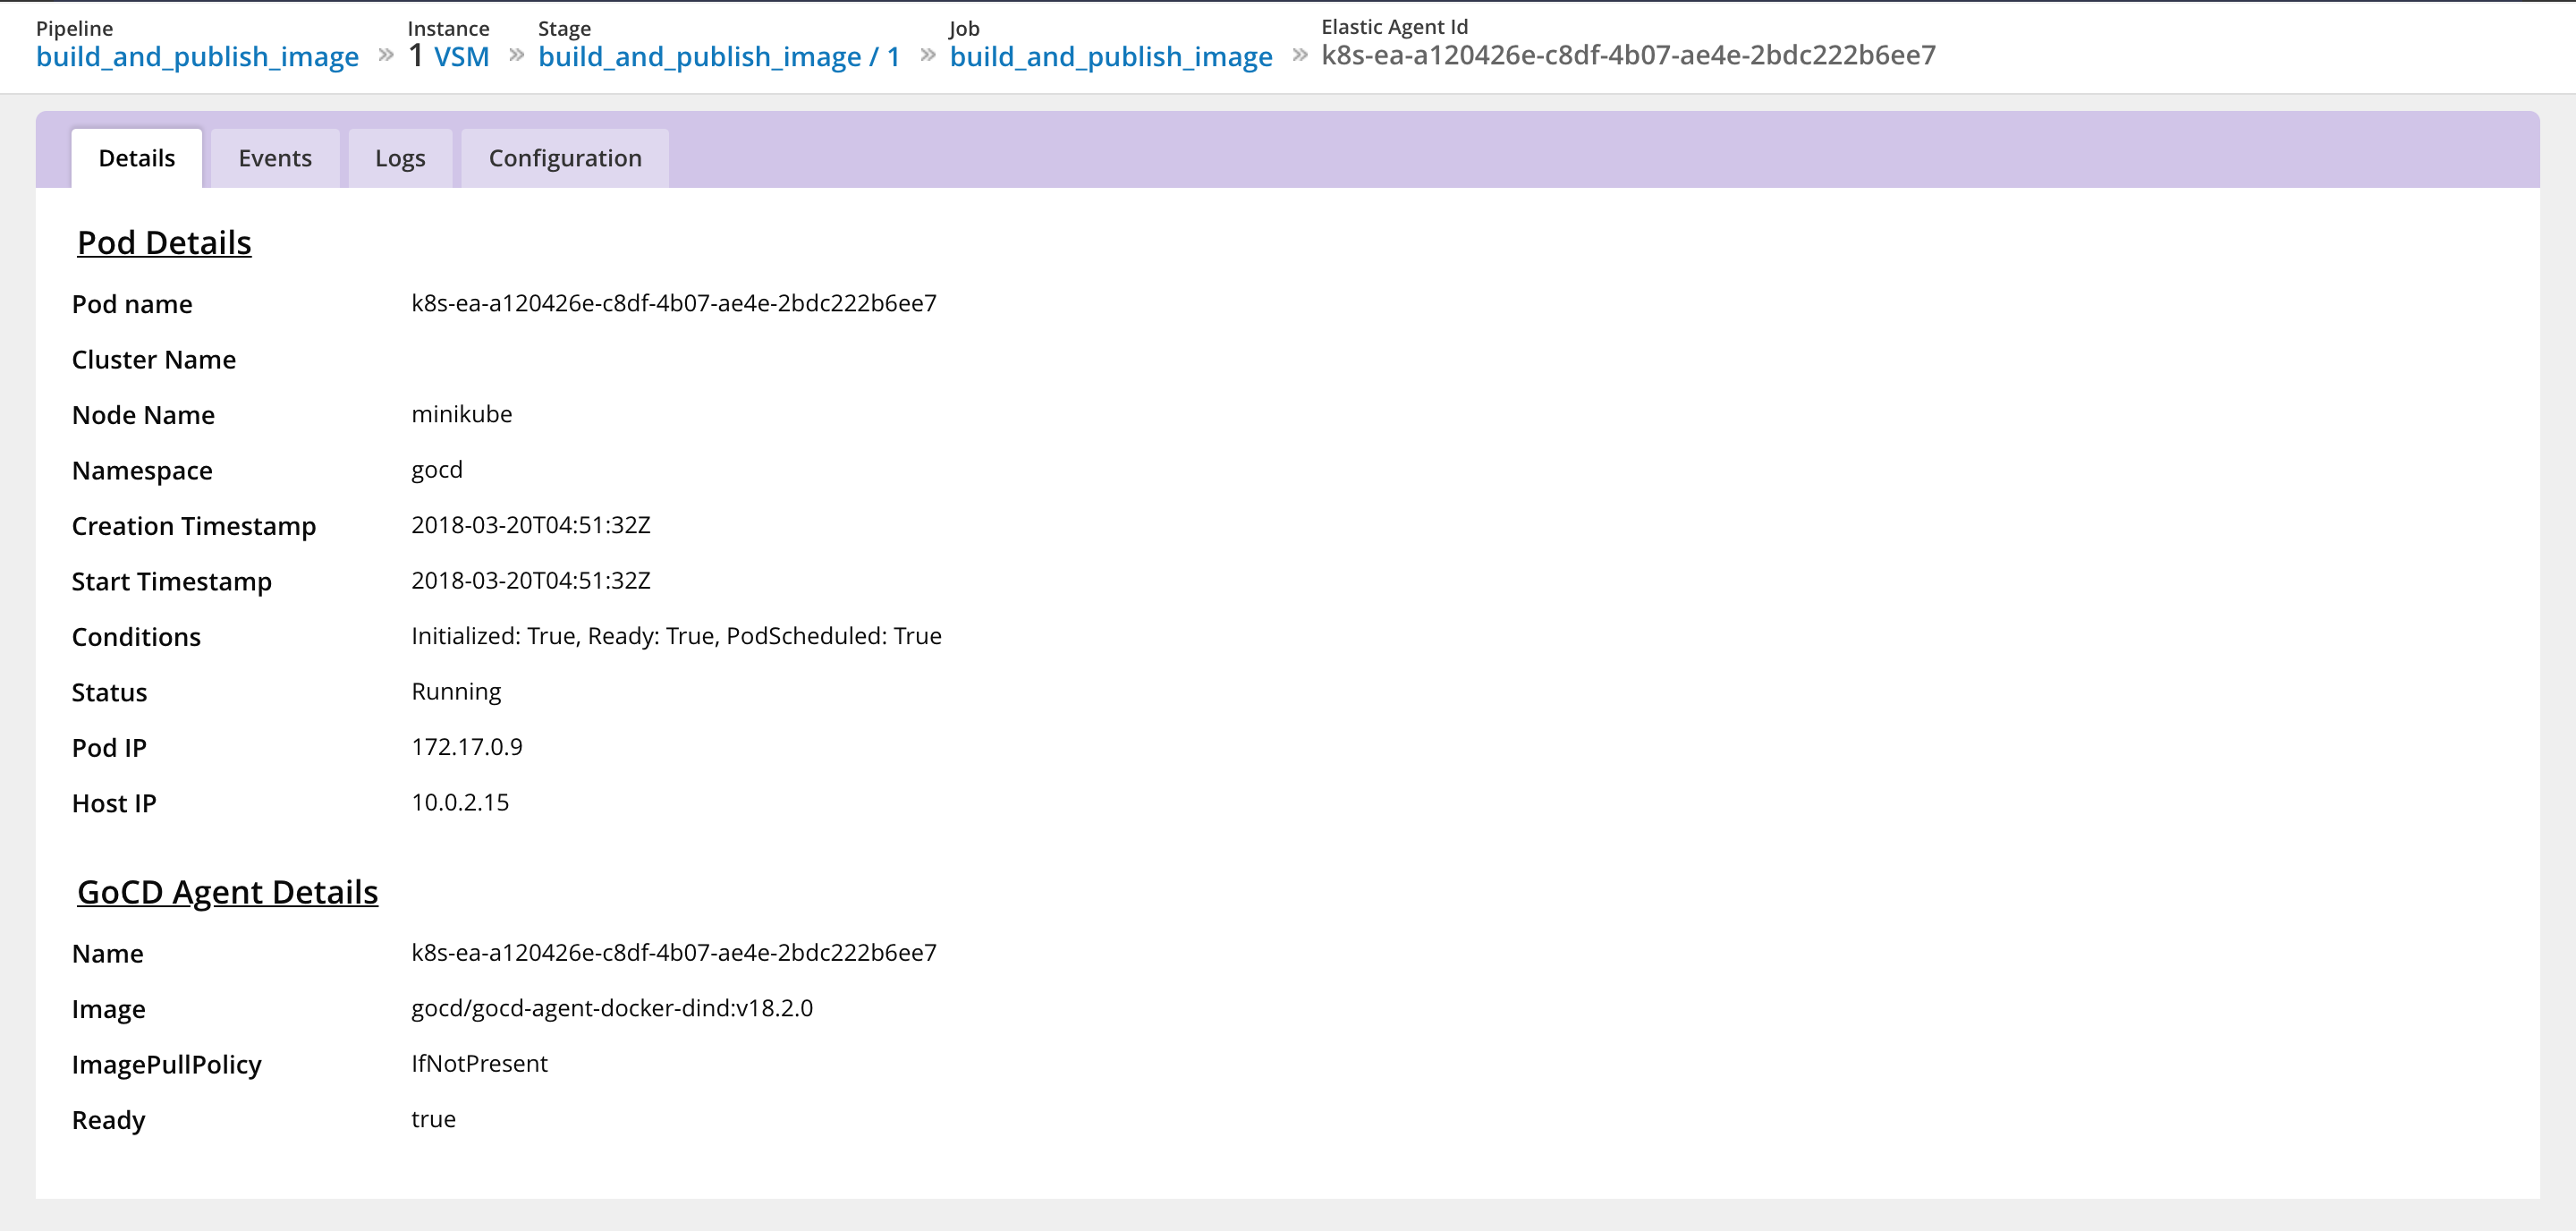
Note: The Agent Status Report is only visible when a job is running. Once the job completes, this status is no longer visible.
 Suggest edits to this page